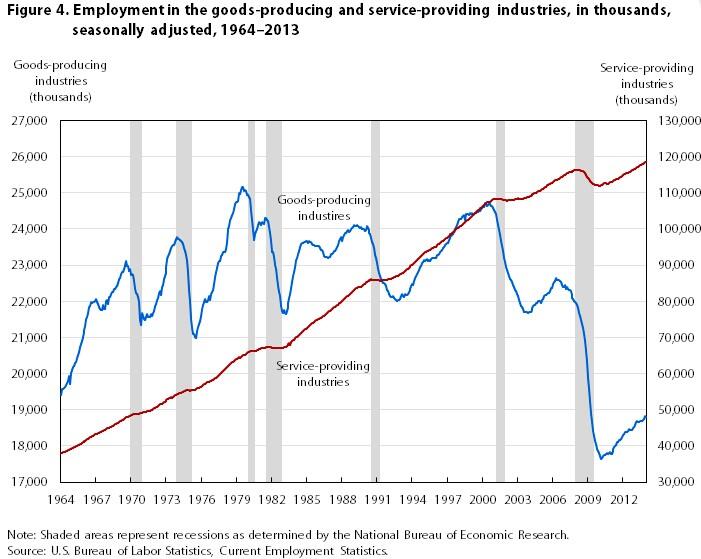
One graph that explains the true and irreversible trends of the share of industry over time. It does not mean that industry if becoming irrelevant: we will still need goods in the future the same as we need to eat and drink from agriculture. It just means that the growing share of the service economy is irreversible. This is due to the success of industry: by ever increasing productivity there are less people needed to produce more and more goods for a decreasing price. Just as agriculture has become a small part of economy, because it is so successful: less people are employed in agricultural sector to feed a nation and less percentage of income in rich countries is spend on food. The same will be the case for manufacturing: less people will be employed and a smaller share of income will be spend on actual goods.
Here the graph:
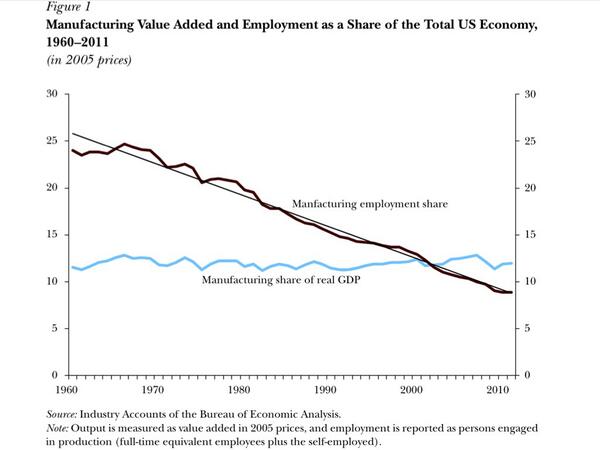
UPDATE 2nd Graph for USA:
No comments:
Post a Comment